June Design Update

It's been a while since we've had a design update. To be totally honest, last month was a bit light in terms of NEW feature releases. However, while there hasn't been a lot of new features, we've been busy shipping a few really BIG changes to the product.
Responsive UI
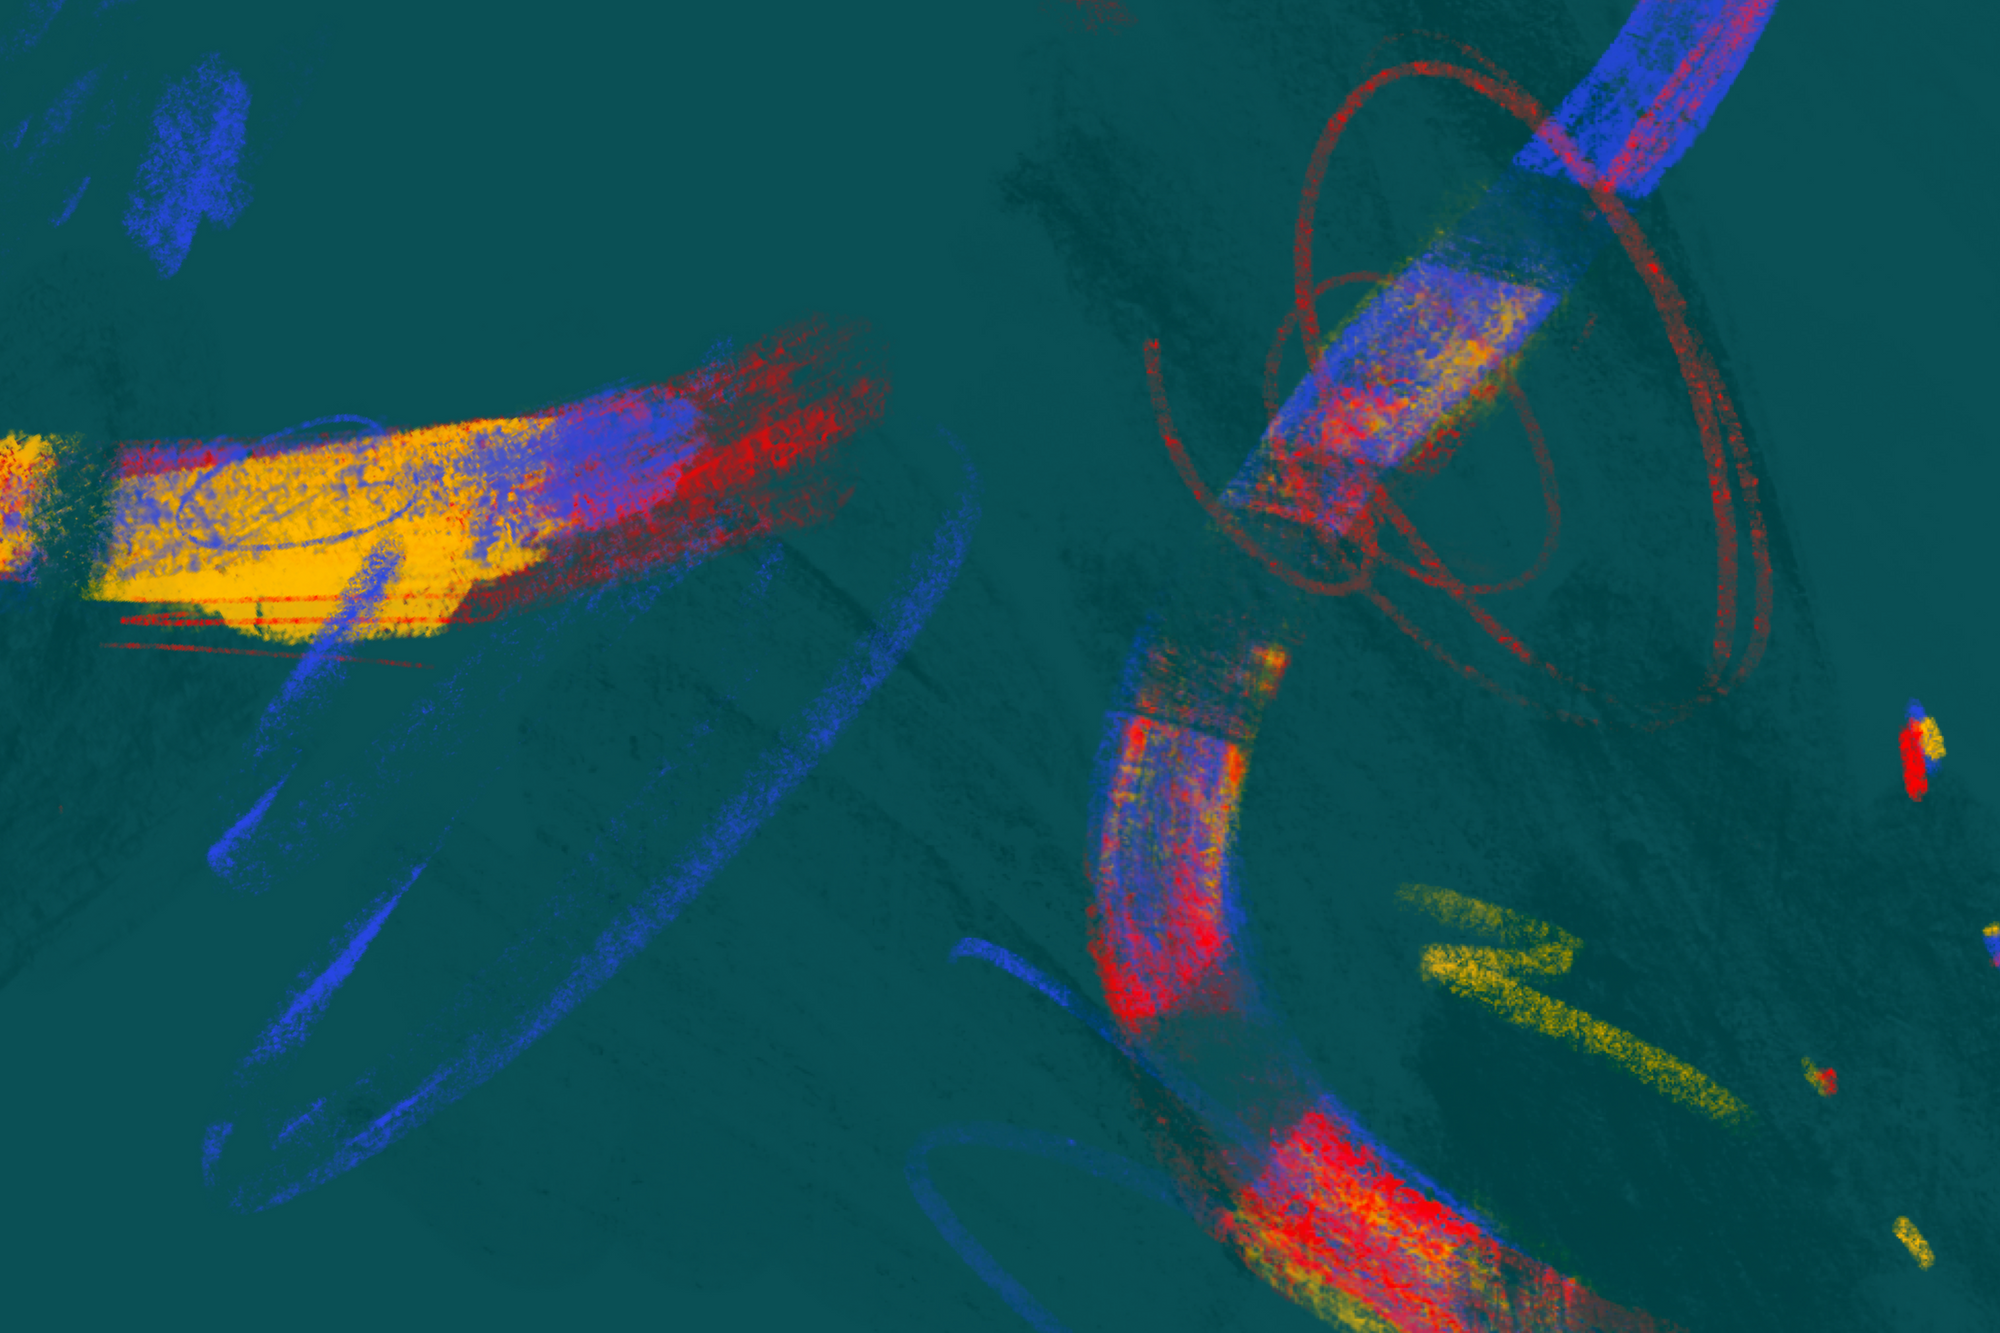
This one has been on our to-do list for a long time, and it's finally here! You can now view the Tability web app on all your devices. We still have some UI elements to clean up but check it out and please give us some feedback.
More on it here 👇
New Goal Types
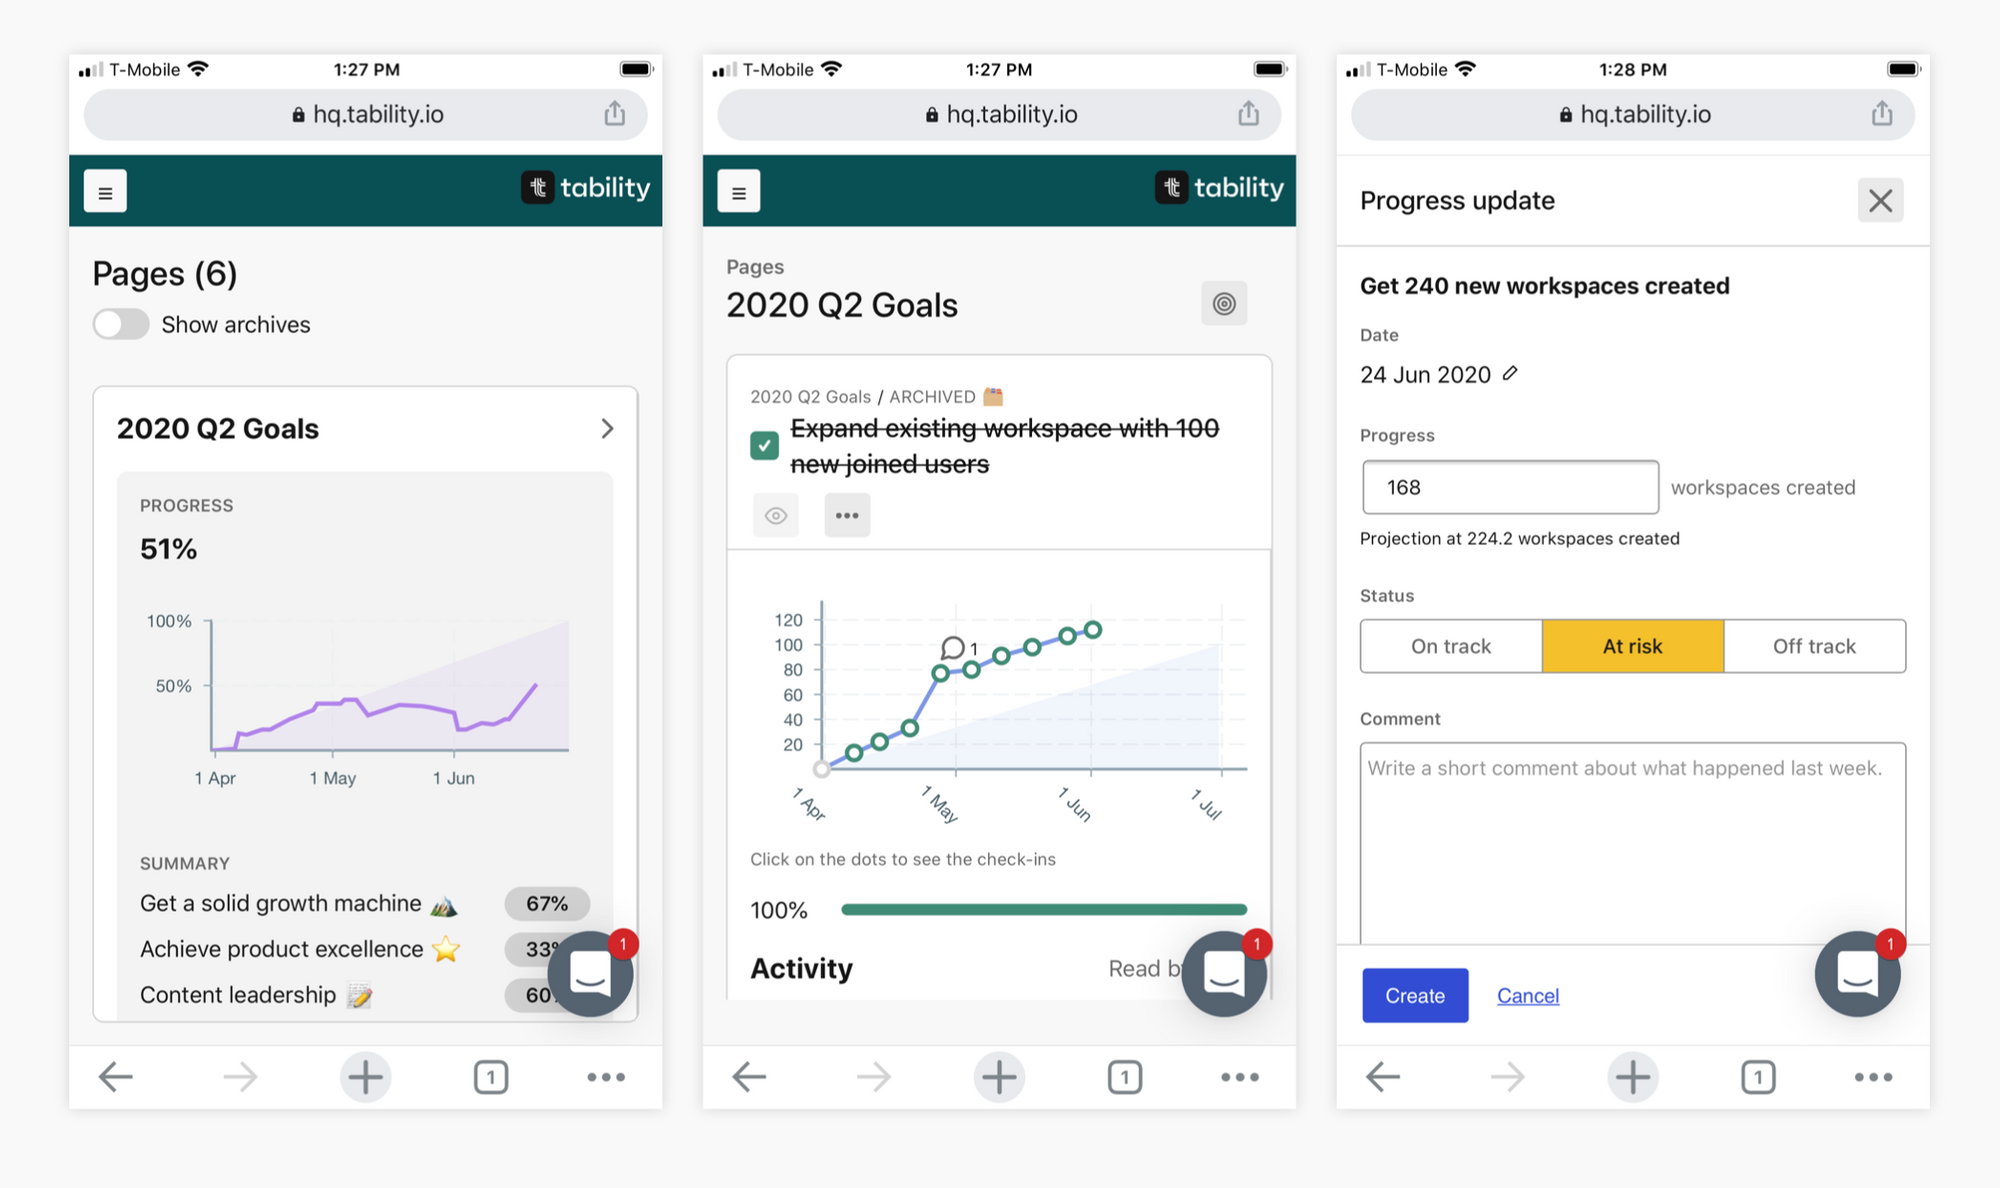
Until now, Tability has been really good at tracking metrics that start at one number and climb to a larger number. This isn't ideal for measuring fluctuating metrics, or averages. For example, if your goal was Maintain an NPS Score of 40, you'd set the starting value at whatever your value was on day one, and the target at 40. Like below 👇
Problem with this, is even at 36 NPS above, the progress bar at the bottom will always show 0% progress because it's only tracking the rise from initial to target value.
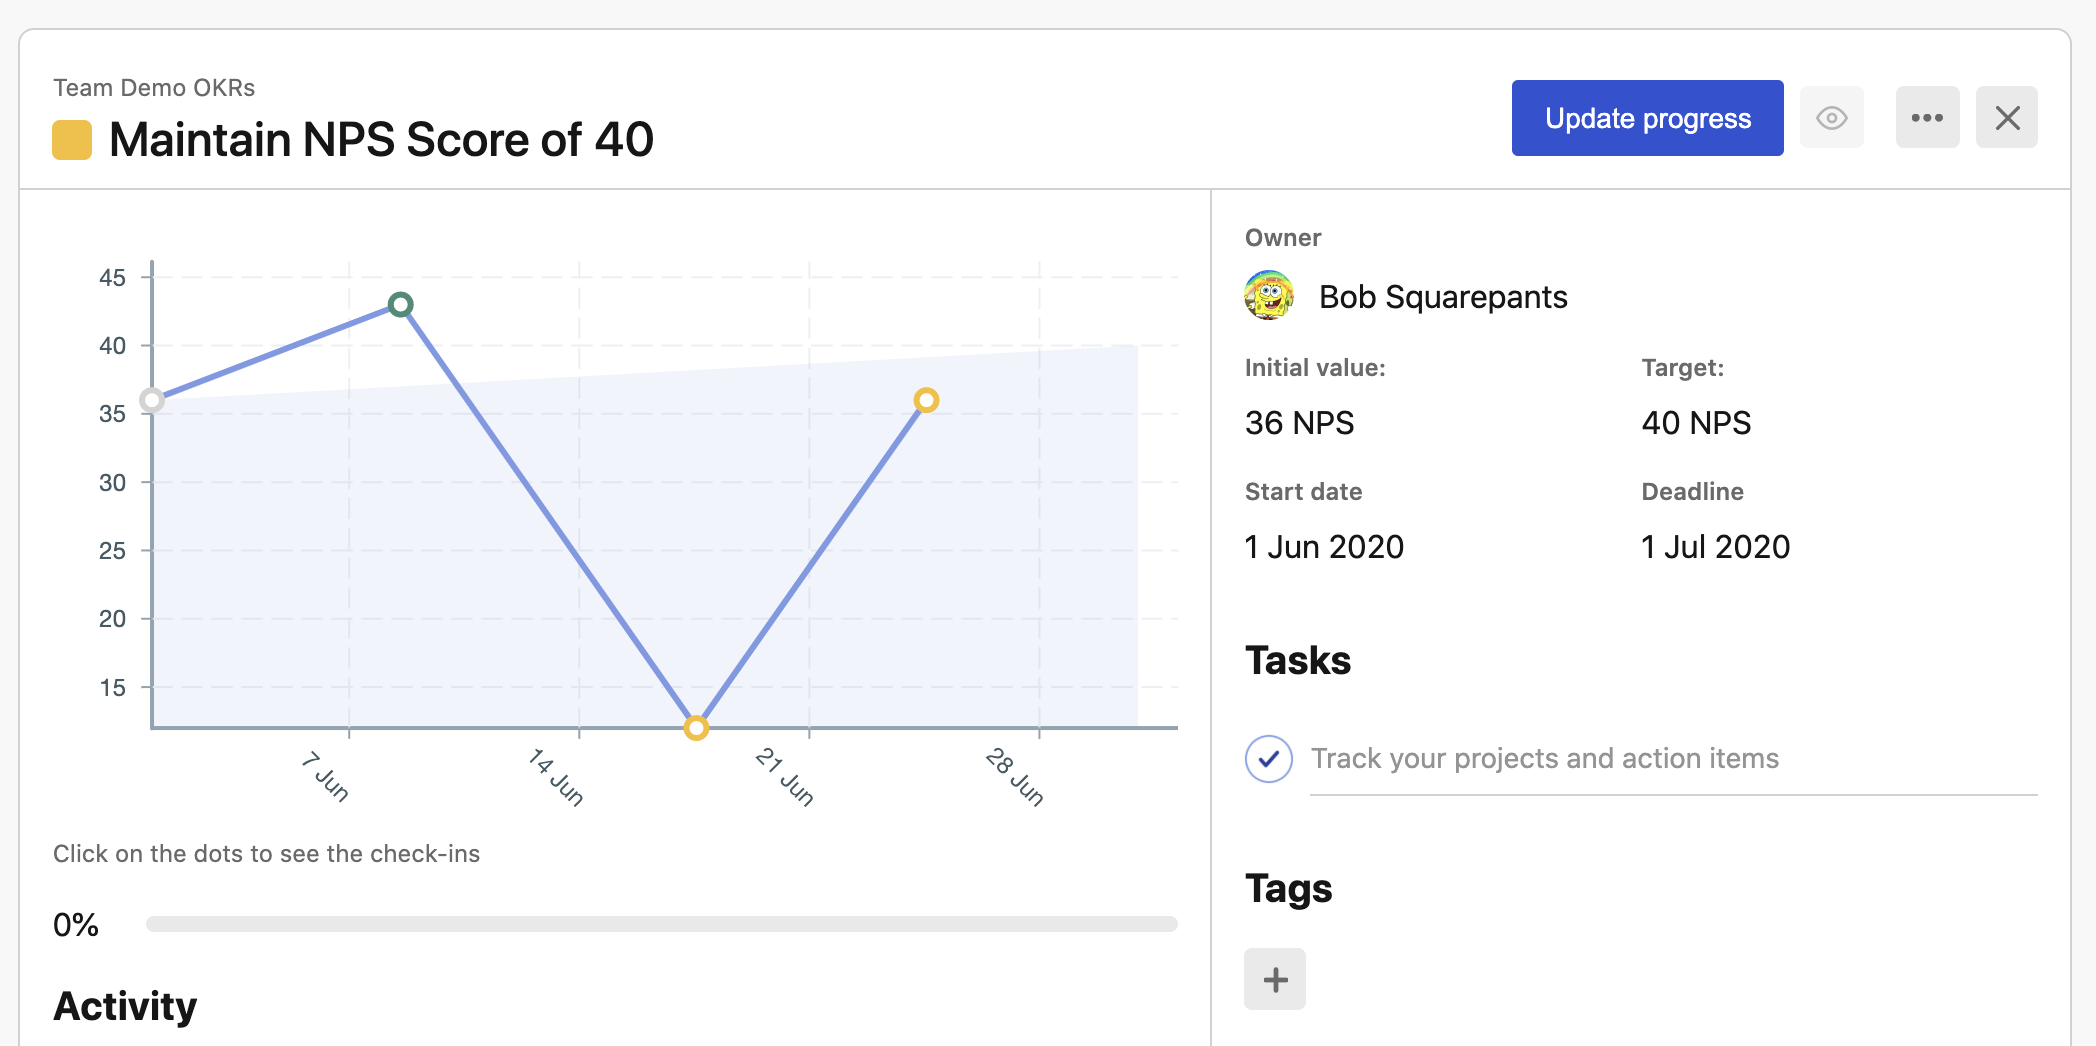
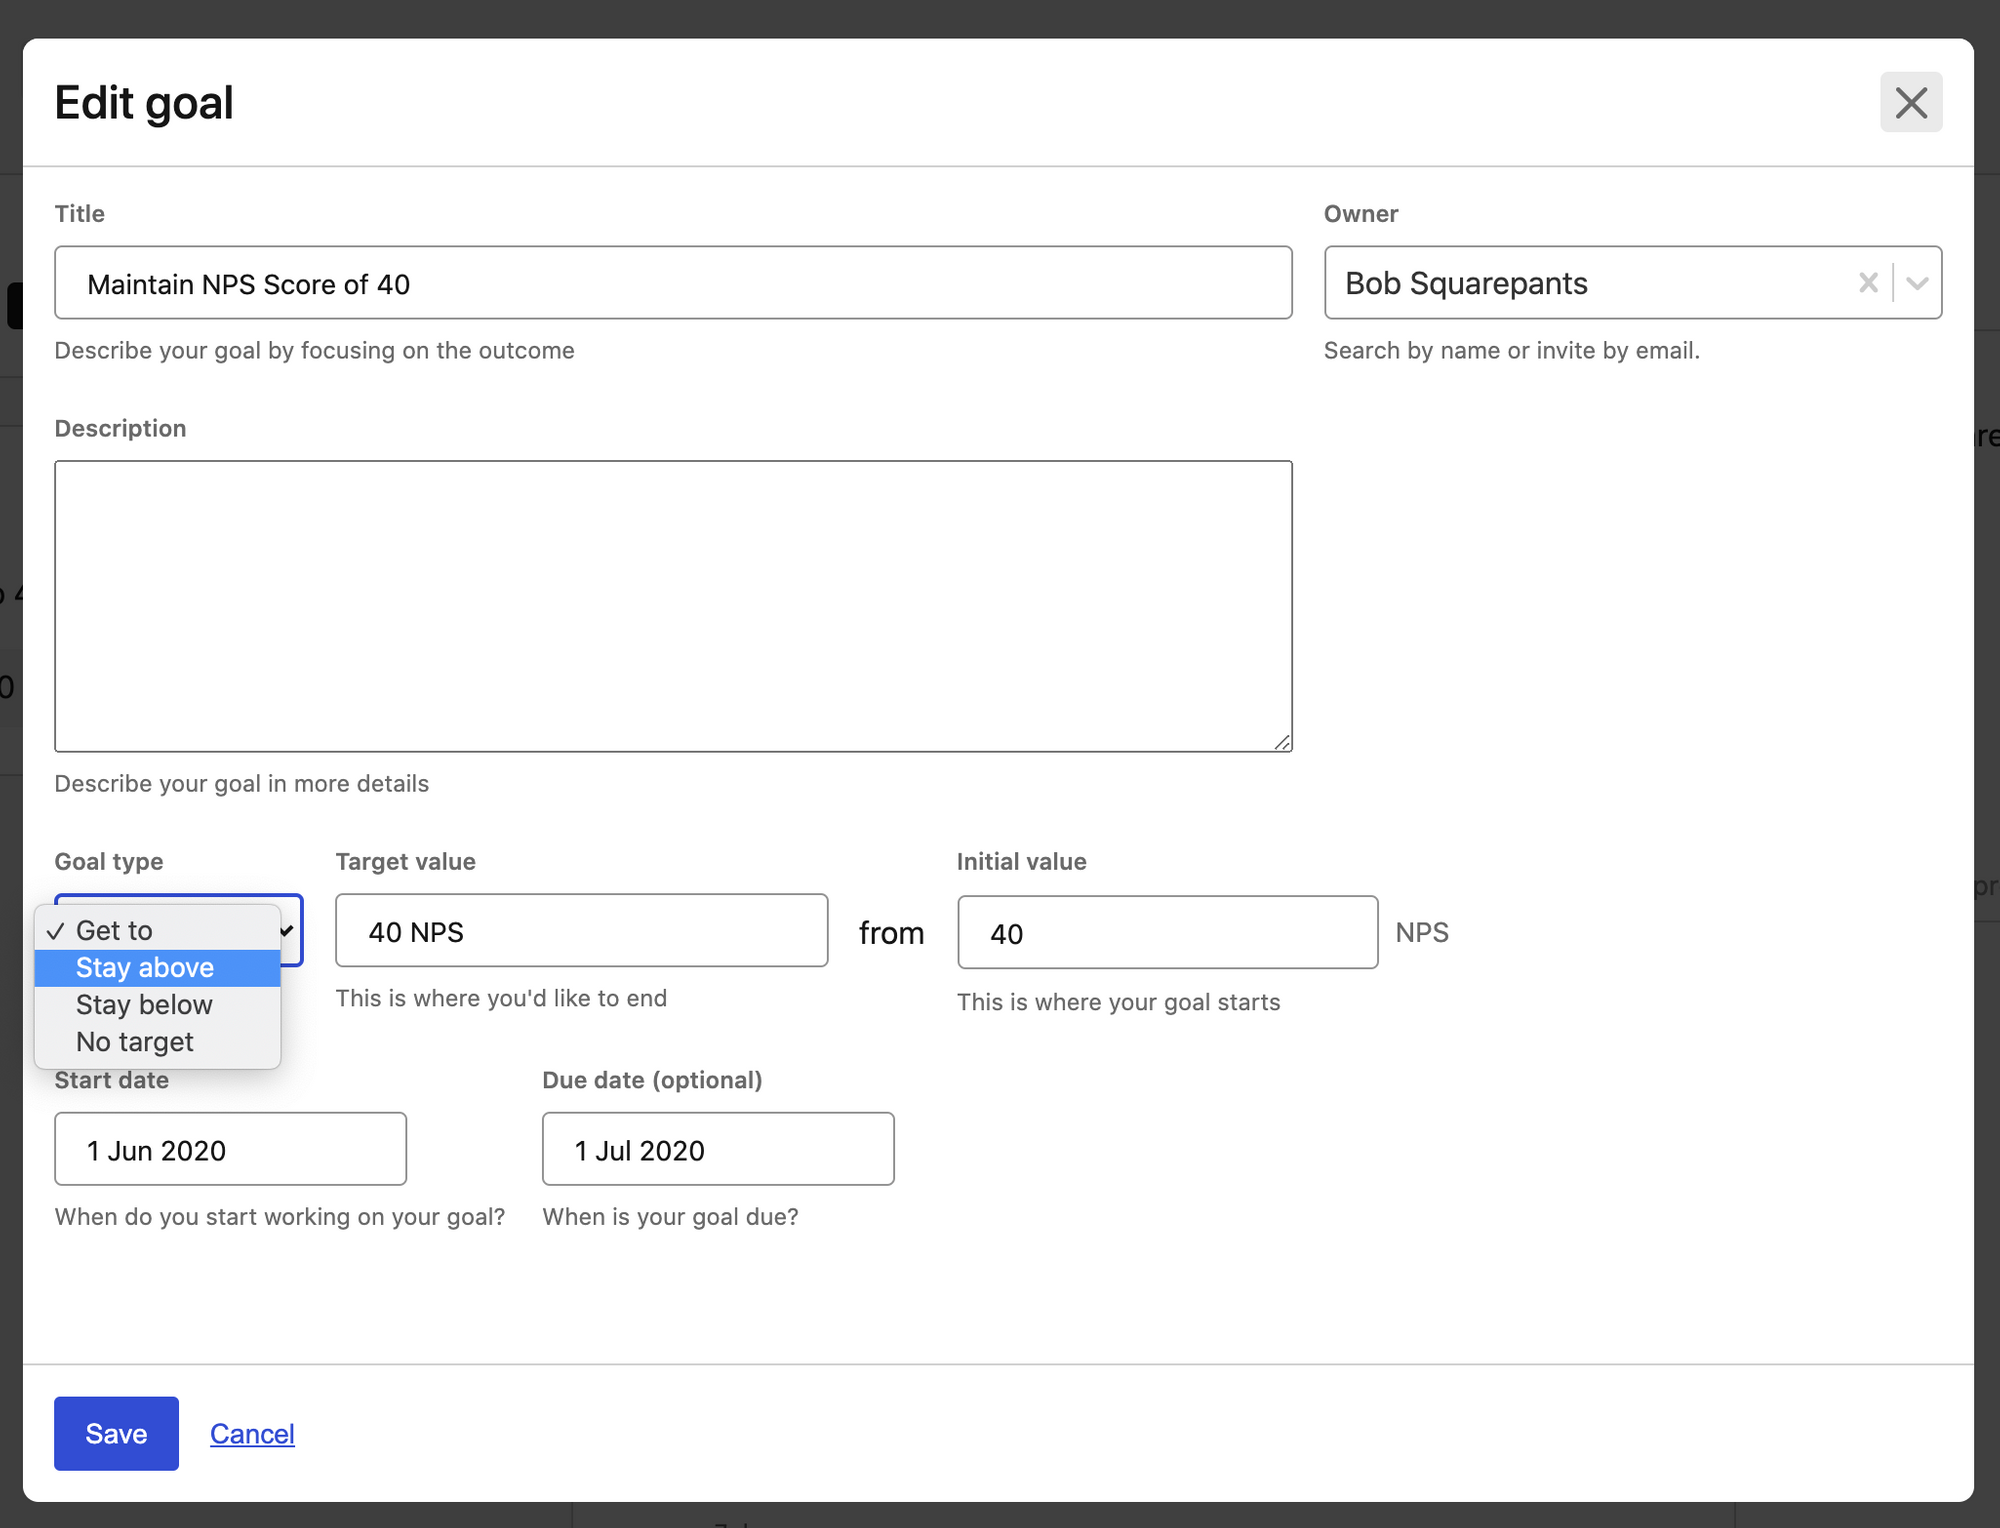
Now we can set in Tability what kind of metric it is. One new goal type is "stay above" which will measure the percentage of a target value. So if you have 36 of 40 NPS, your progress will show 90% instead on 0%.
New Page Progress Charts
Charts and graphs are a powerful thing. Seeing progress and trends are always an easy way to dissect a set of information. Now every page has an overall progress chart, that measures how the page as a whole is progressing, over time.
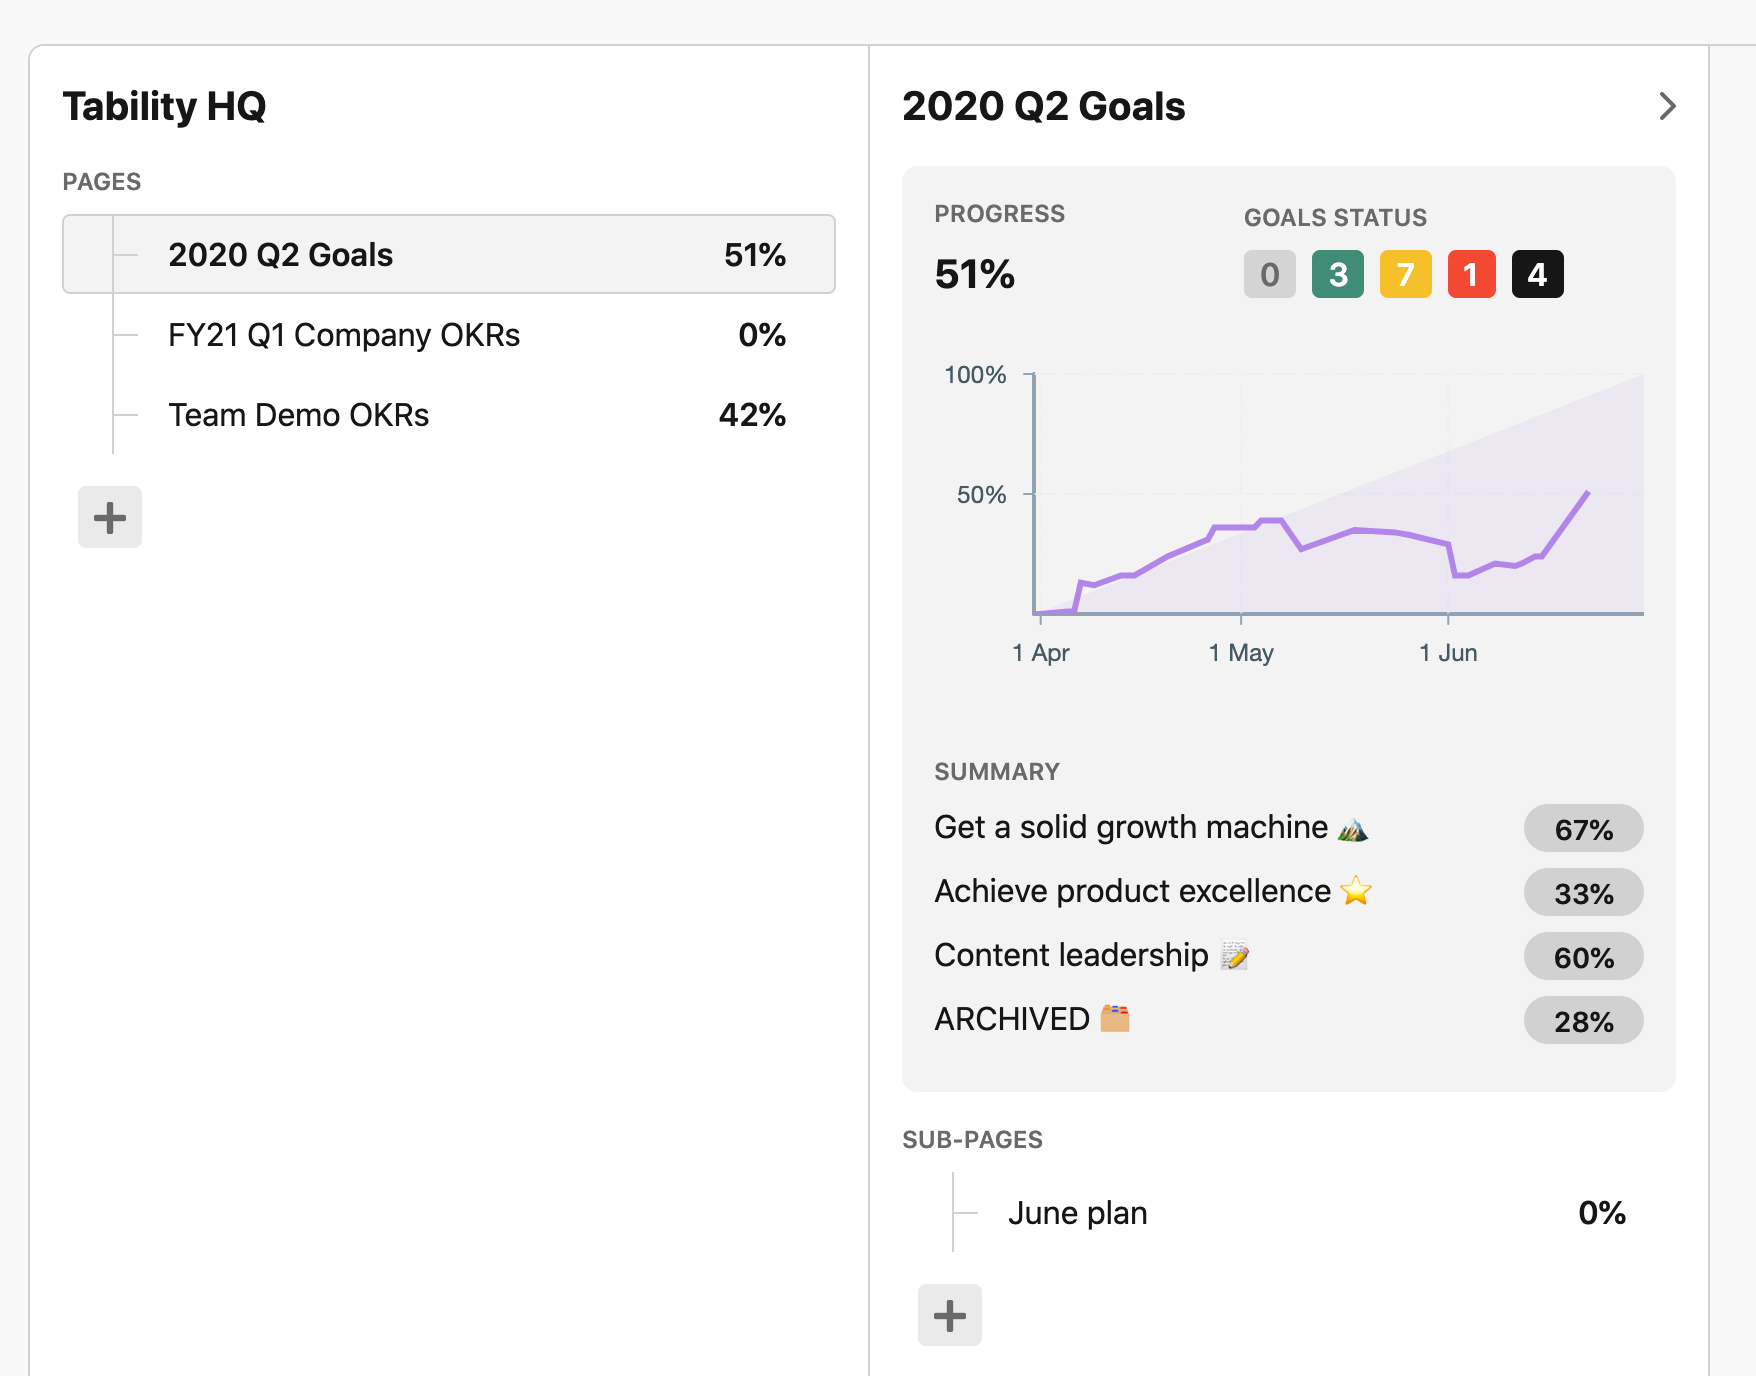
If you're in charge of many teams or pages at once, this view will make it easier to assess which pages are getting behind and need your attention right away.
As always, please let us know how we're doing and what you would like to see. We're always looking for new feature suggestions to build a better solution for your needs. For easy contact, join the conversation in our Slack community! 💬