Feature Roundup – More Stats on Outcomes and Emoji Reactions!
Understanding what's going on in your business is important, and we're bringing you more data points and graphs to help you stay on that company pulse!


Charts are bicycles for the mind. They make it 10x faster to understand what's going on – and when it comes to your business, it's so important to have a pulse on what's going good and what really needs your attention.
This is what we have in mind as we're building the features the past few weeks. More visuals and more data to help you succeed with your biggest goals.
✨ What's new
Insights in outcomes listing
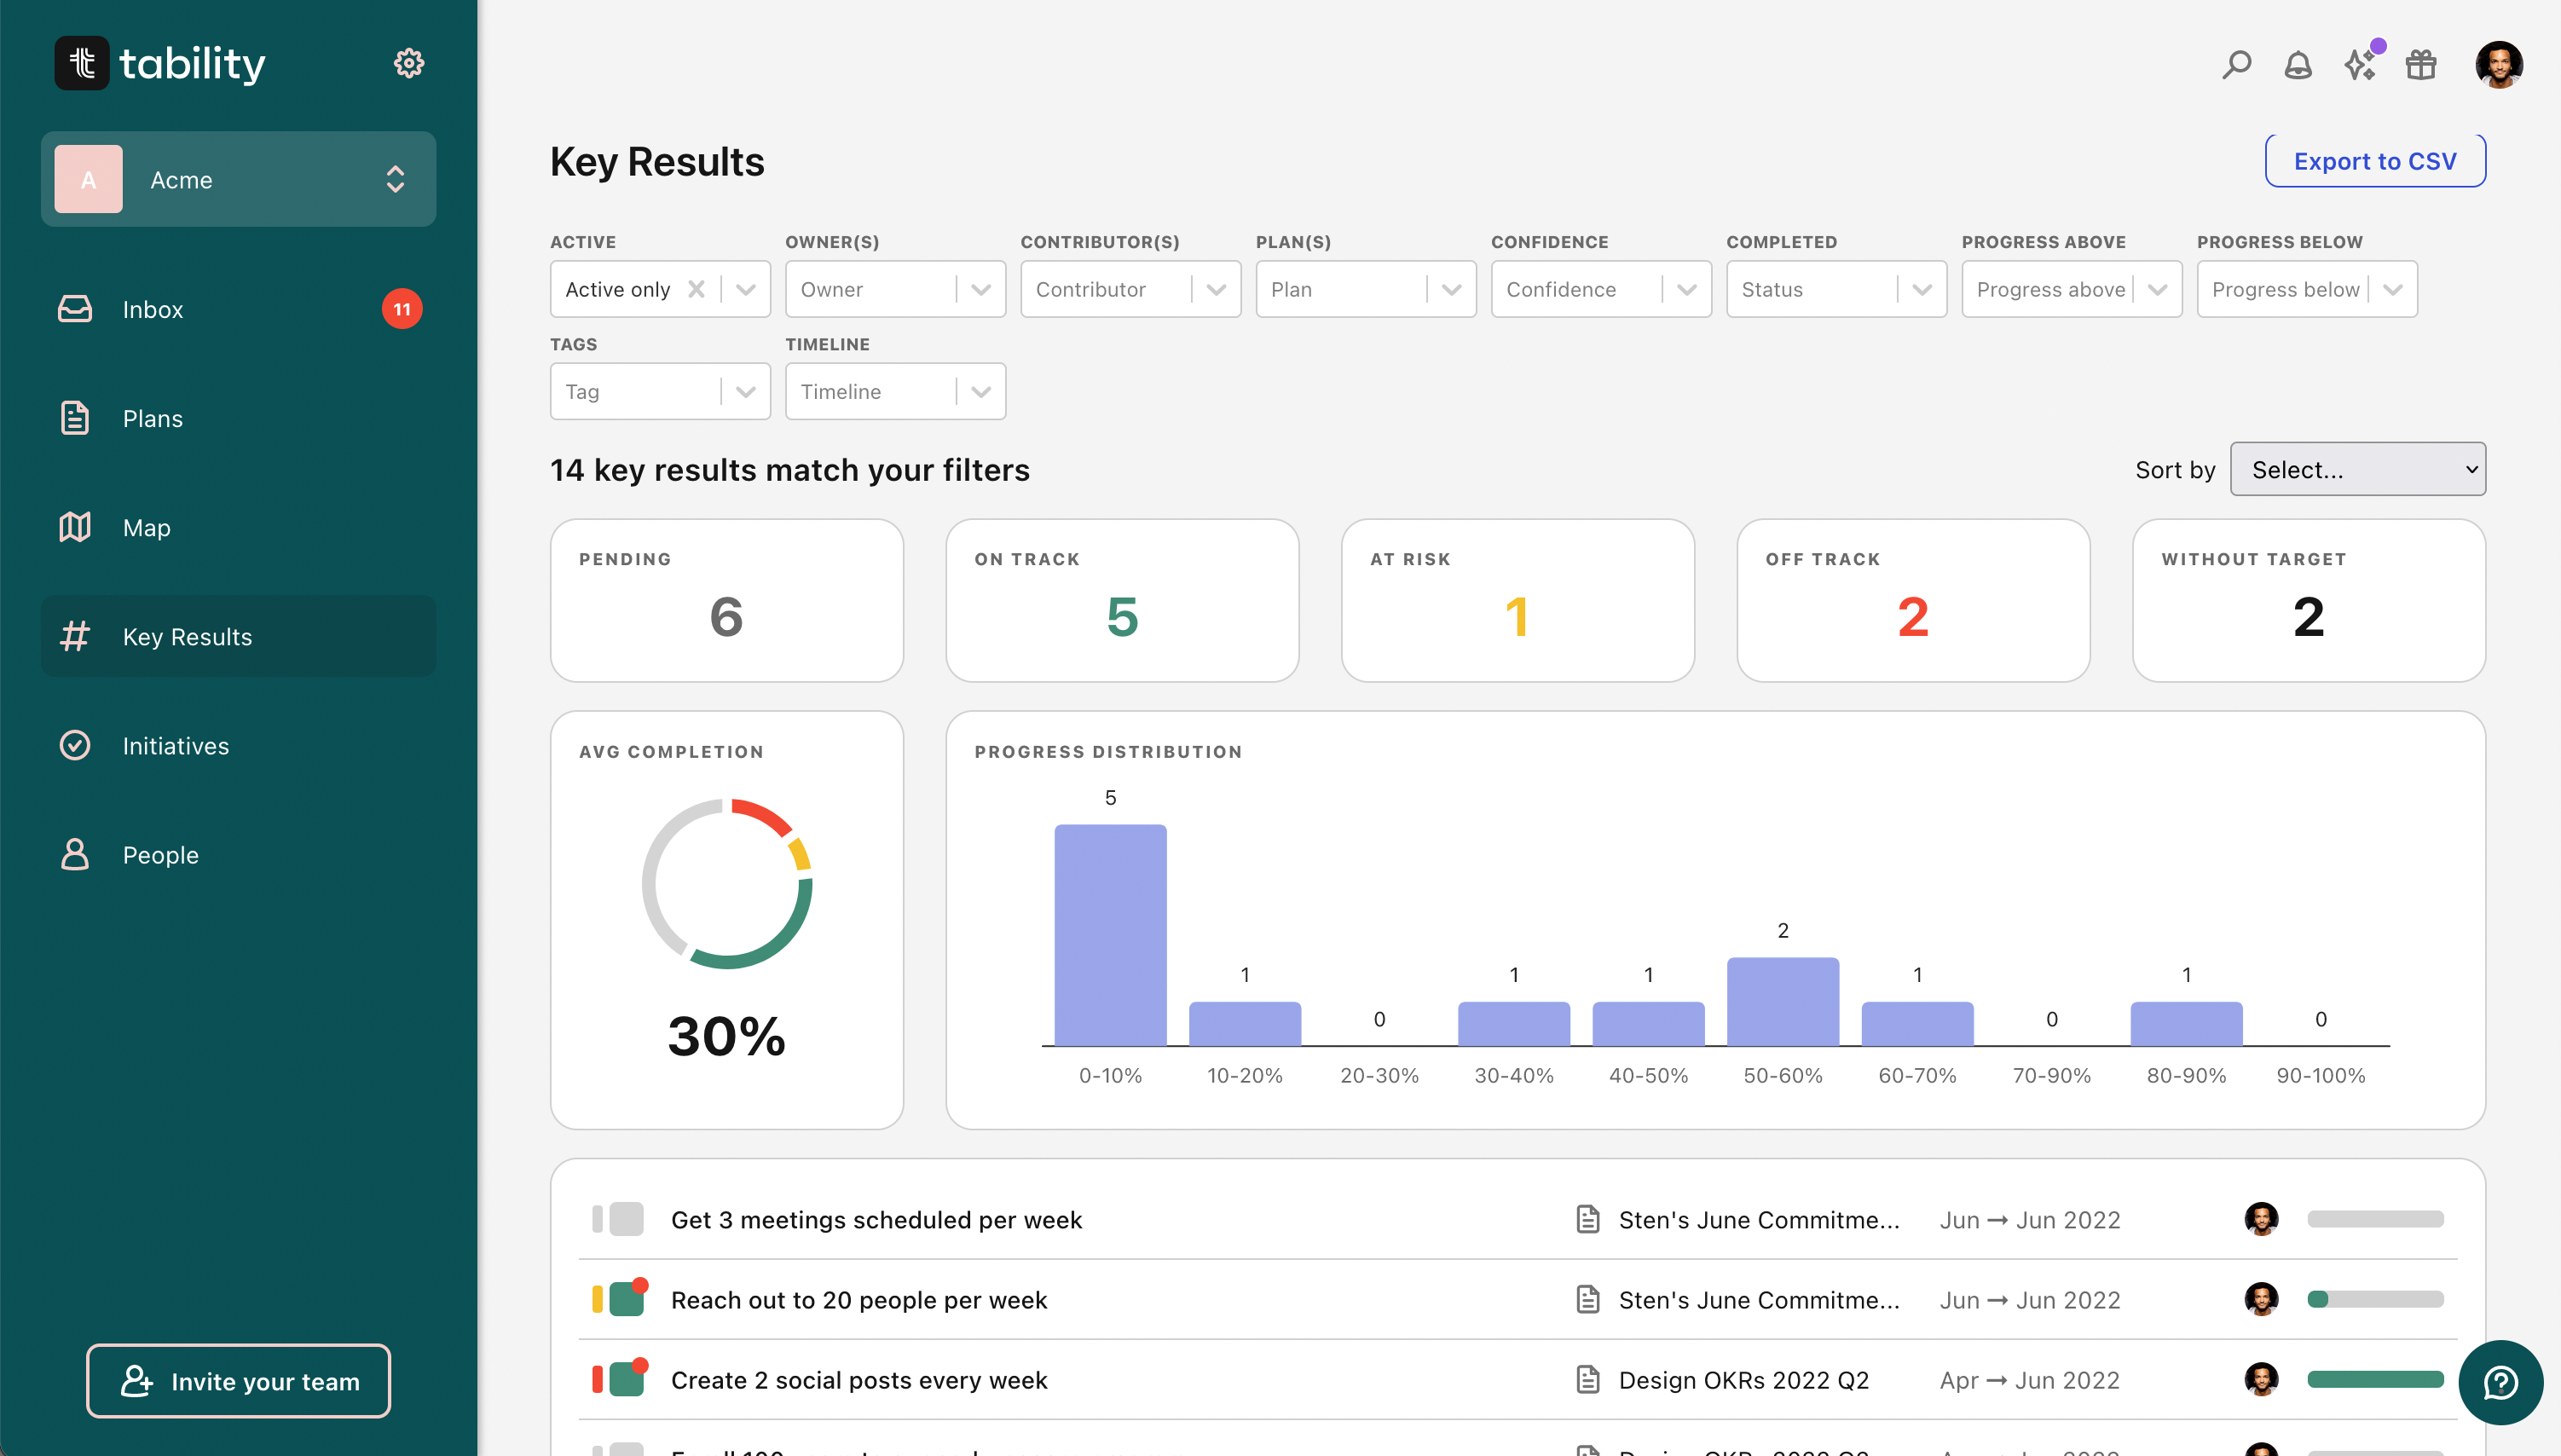
You'll find new stats and insights in the outcomes listing to help you understand the state of the goals in your workspace.
Celebrate achievements with reactions
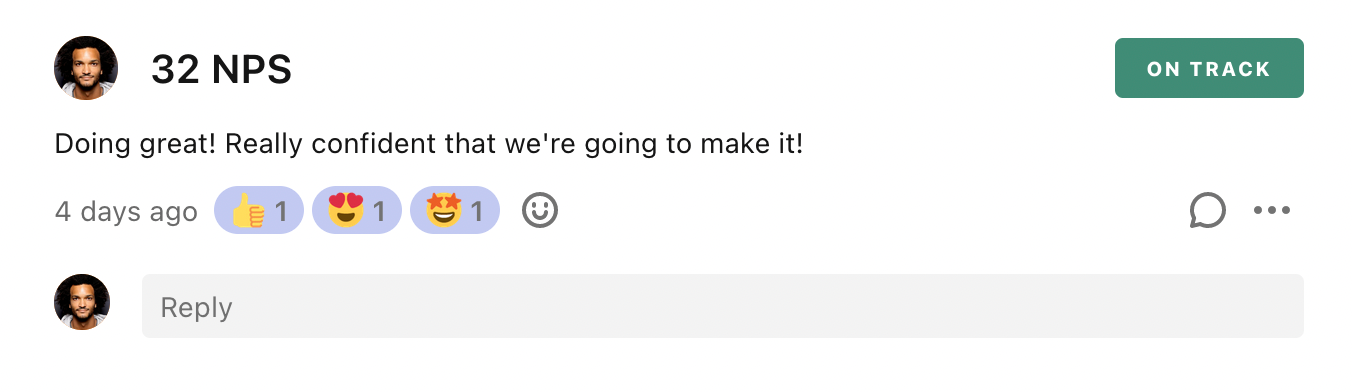
You can now show support to your teammates by adding reactions to check-ins and comments ☺️. It's a nice and easy way to acknowledge the efforts of the team, and it adds a more personal feel to collaboration!
💭 Content Highlights
- OKR Methodology: Your Handy Explainer
- 30 KPI Examples to Supercharge Your Business
- KPIs for Marketing you need to know
Don't forget to follow us on twitter or linkedin! We have tons of content on there all the time 🐥
We'd love to hear from you
That's all folks! Please reach out or add your suggestions directly to our public roadmap if you have feedback or questions. You can even vote for features already planned to expedite them. If you want to chat to us directly or connect with other users, you can also find us in the Tability Slack Community.
❤️ ❤️ ❤️