We're done. How about you build your own OKR dashboard?
We're sick of building dashboards for you. So we made it possible for you to build your own custom OKR dashboard.

Tability is your OKR command center. It's designed to surface all the data that you want to know about your OKRs, answer all the questions, and show it to you in a digestible and visual way.
To do that we've built a lot of different OKR dashboards; one for every use case we can think of. Wanna see how all your goals are connected? There's a view for that. Wanna see every goal across the org that's in the red? There's one for that too. Wanna see what Dave over in accounting has been up to? Not much, but there's a view for just that too... Come on, Dave.
Every day we're designing and building new ways to see your OKRs — to shed new light on your progress, your team, and your strategy.
But we're tired of it. We're done. We're sick of building new dashboards for you.
WHY DON'T YOU BUILD IT?

... Because now you can 😇
Every company does their strategy different and their needs are different too. Rather than building more views that may or may not work for your team, we decided to dedicate our time into putting a more scalable system in place.
With Custom Dashboards, you can now build the dashboard of your dreams. Drag, drop, organize all the information you're looking for into one page so that you can track everything you care about in a single view. Heck, make 2, or 3, or 10 dashboards—one for every question you have about your OKRs.
This and more in our newest feature release. Read more below 👇
What's new in Tability 🥳
We're always building stuff! Here's a rundown of all the latest features in Tability.
Custom Dashboards! (beta)
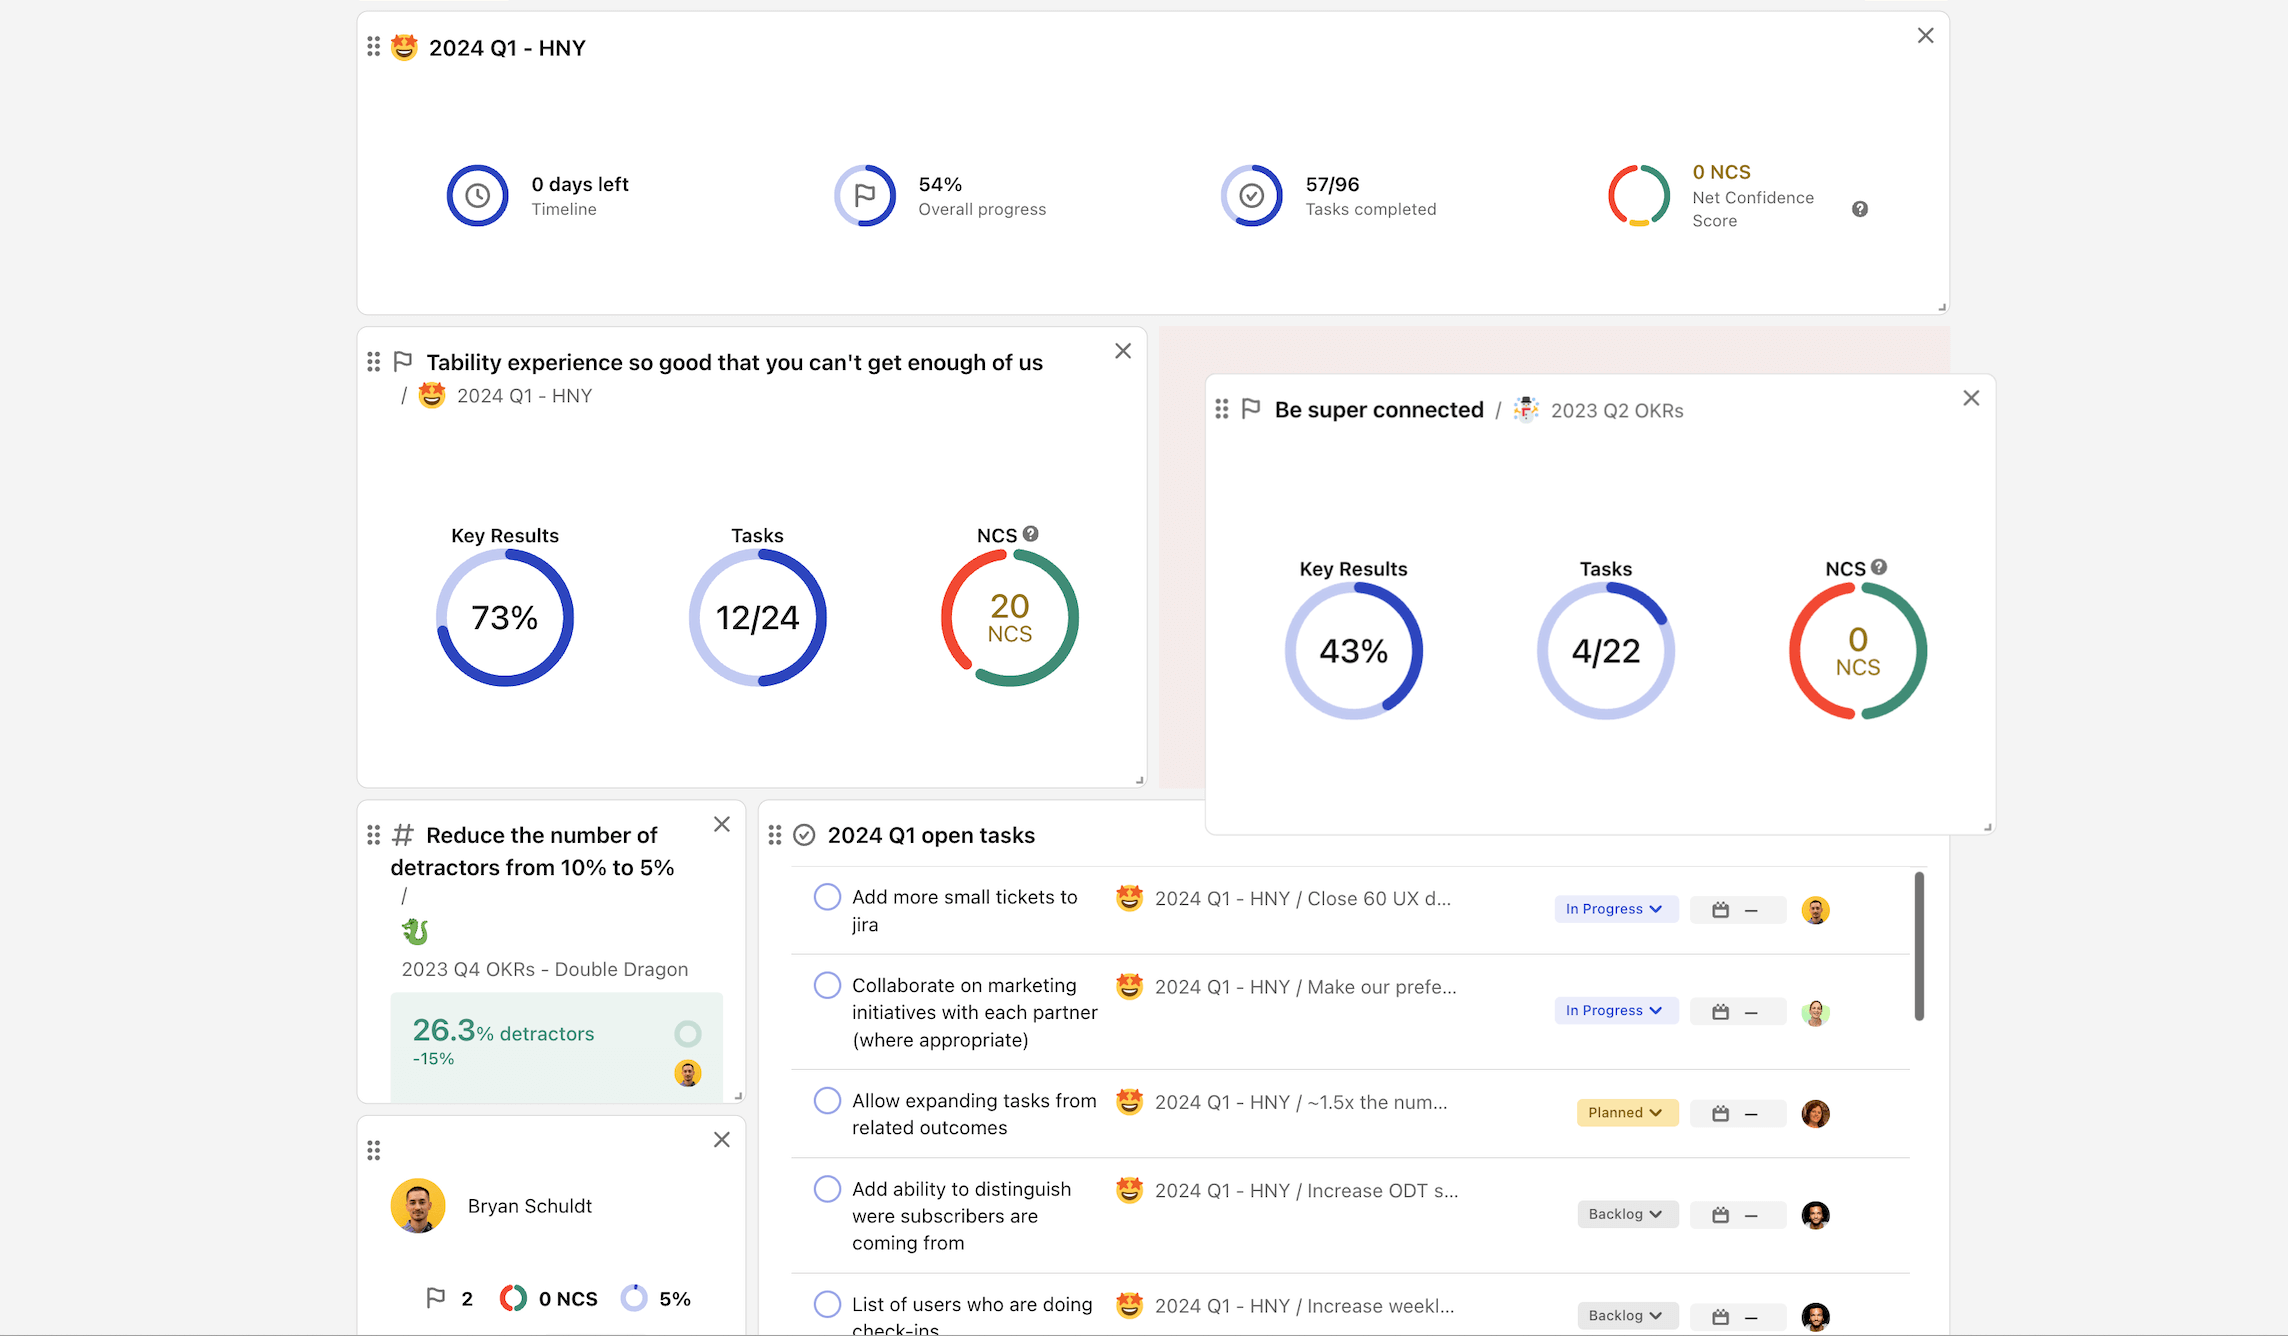
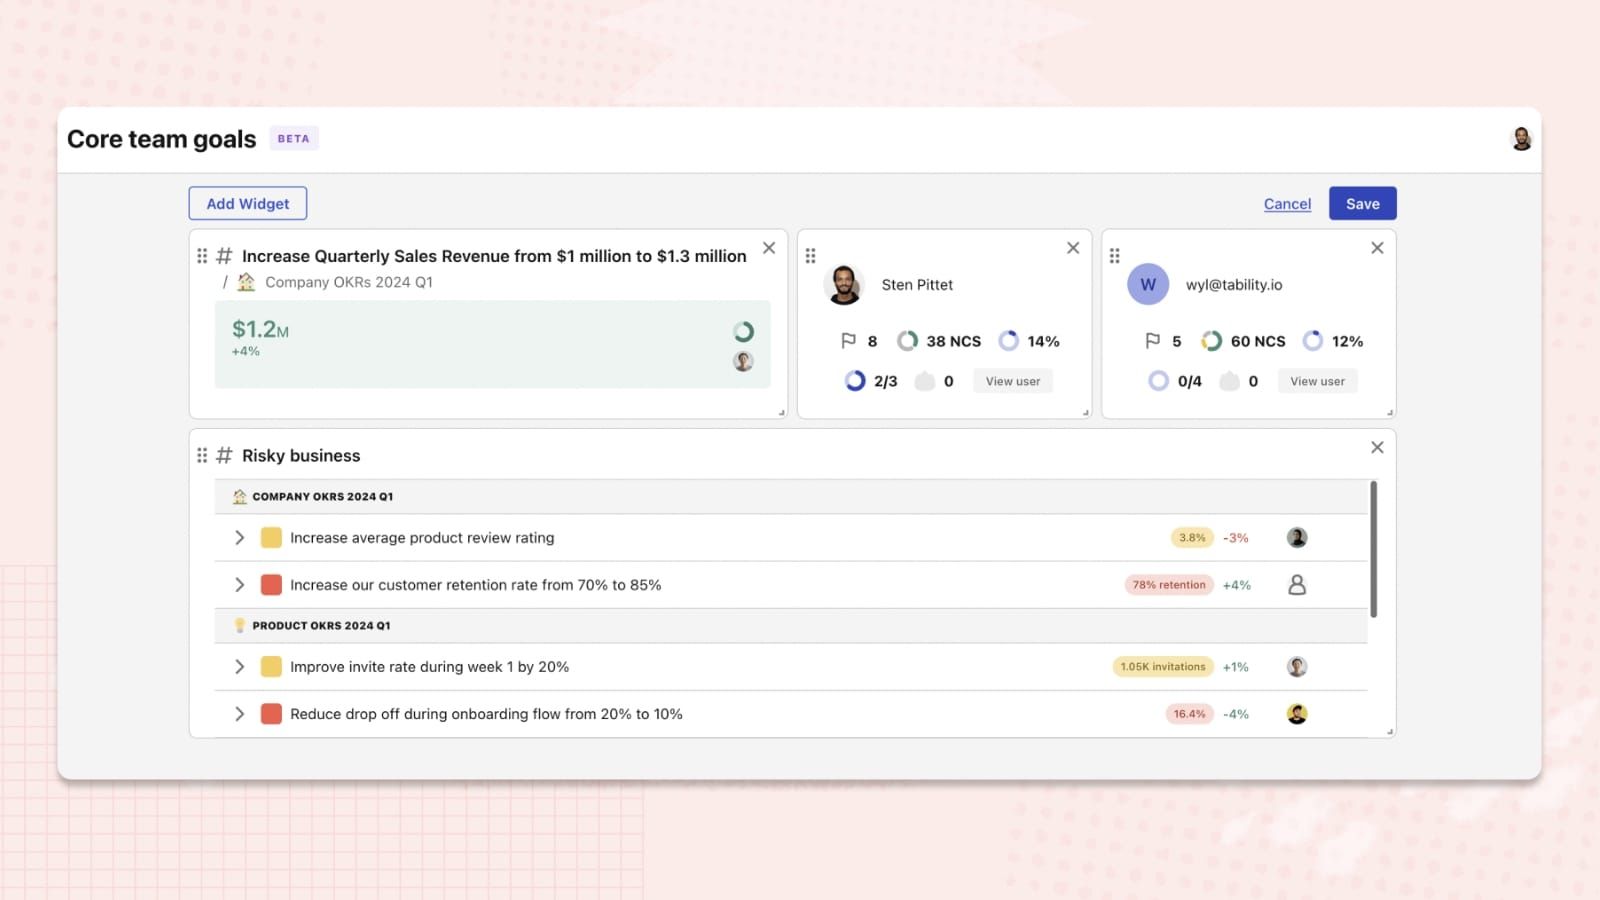
Custom Dashboards allow you to create unique views that combine information from different sources using widgets.
For instance, you can create a dashboard that contains:
- A summary of the top-level company OKRs
- Profile widgets for your collaborators
- A list of all the key results that are currently off-track or at-risk
Drag and drop widgets, resize and organize to create exactly the dashboard you want.
BETA: Go to your workspace now to try this feature out. This feature is currently in beta, so please let us know if there are any bugs or improvements you'd like to see! Your feedback is essential 🙇🏻♂️
Workspace Audit
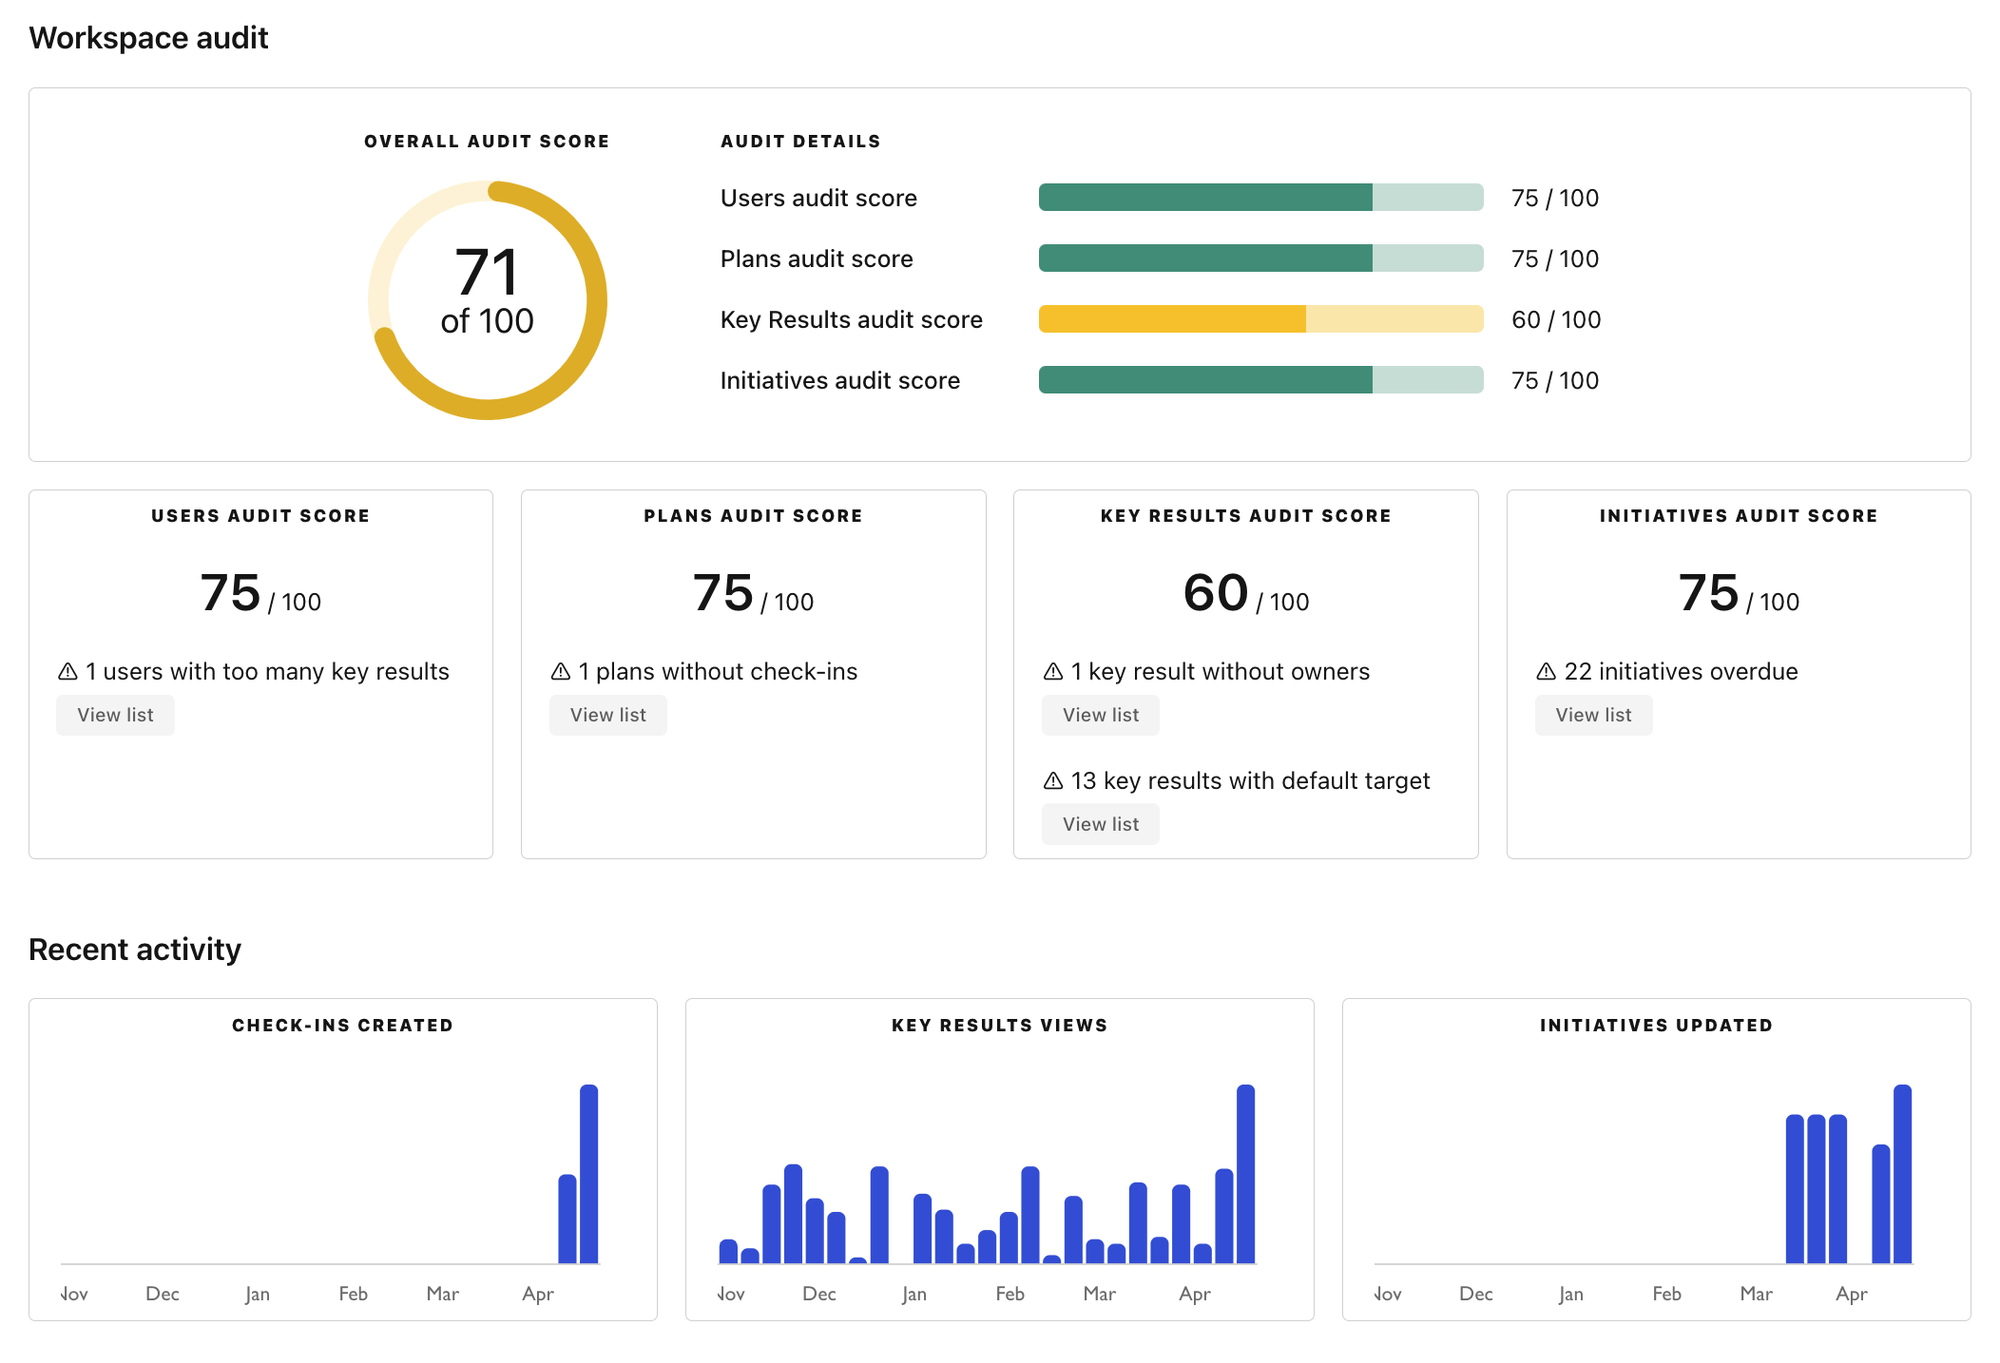
Ever wonder if you're doing your OKRs the right way?
Well there's no exact right way, but we've added some new data to the Insights tab that will help surface errors, mistakes, missing info, or things that can be improved.
Fresh content 🍋
We write a lot here at Tability. Here's the latest from ODT by Tability — our library of resources and best practices.
How to create an outstanding social media report
Learn how to create a compelling social media report with our comprehensive guide. Unlock insights, drive growth, and maximise impact.
SaaS benchmarks: The ultimate list of resources
Discover the ultimate SaaS benchmarking resources for setting better goals and achieving greater outcomes. Optimise your strategies and drive growth.
How to conduct a successful quarterly business review: A step-by-step guide (+ QBR template)
Uncover the secrets to a successful quarterly business review with our step-by-step guide and free QBR template.
How to add AI to B2B tools – 3 case studies
See how B2B platforms Loom, Tability, and Released.so have incorporated AI to improve the user experience.
Love letter or hate mail? 📬
Send us a message to tell us what you think!
- What do you think of the new features?
- Do you have any questions?
- What else can we improve?
- Do you love us or hate us?
You can always reach us through Intercom chat on the Tability website, join 400+ other users in the Tability Slack Community.
You can also email us directly at team@tability.io