7 ways to see progress on your OKRs and goals in Tability
See how Tability can help team leads and contributors visualize progress on their goals and OKRs.

Tability is a simple goal-tracking platform that you can use for OKRs, KPIs and strategic initiatives. It's purposedly light, so you can quickly share feedback on your goals, but it still packs up a good punch in terms of capabilities.
In this post, I'll show you some of the views that can help you keep track of progress on your goals, whether you're an individual contributor or a team lead.
For individual contributors
There are a few things that are important for individual contributors:
- A quick access to all your goals.
- A simple way to make sure your top priorities are on-track.
- Being able to see how the rest of your team is doing.
See all your top priorities from your dashboard

When you work in large organizations, you often have responsibilities spanning horizontally across multiple teams, or vertically within your department.
Rather than having to go through several spreadsheets and docs to see what your top priorities are, Tability makes them all accessible from your dashboard. You can update progress on all your goals from a single place, and you can quickly assess if something requires attention.
Visualize progress with the activity chart

You can dive into the details of a specific goal and see all the history of updates. The progress chart will make it easy for you to see trends to understand if you're slowing down, or if growth is picking up.
Keep track of your team updates

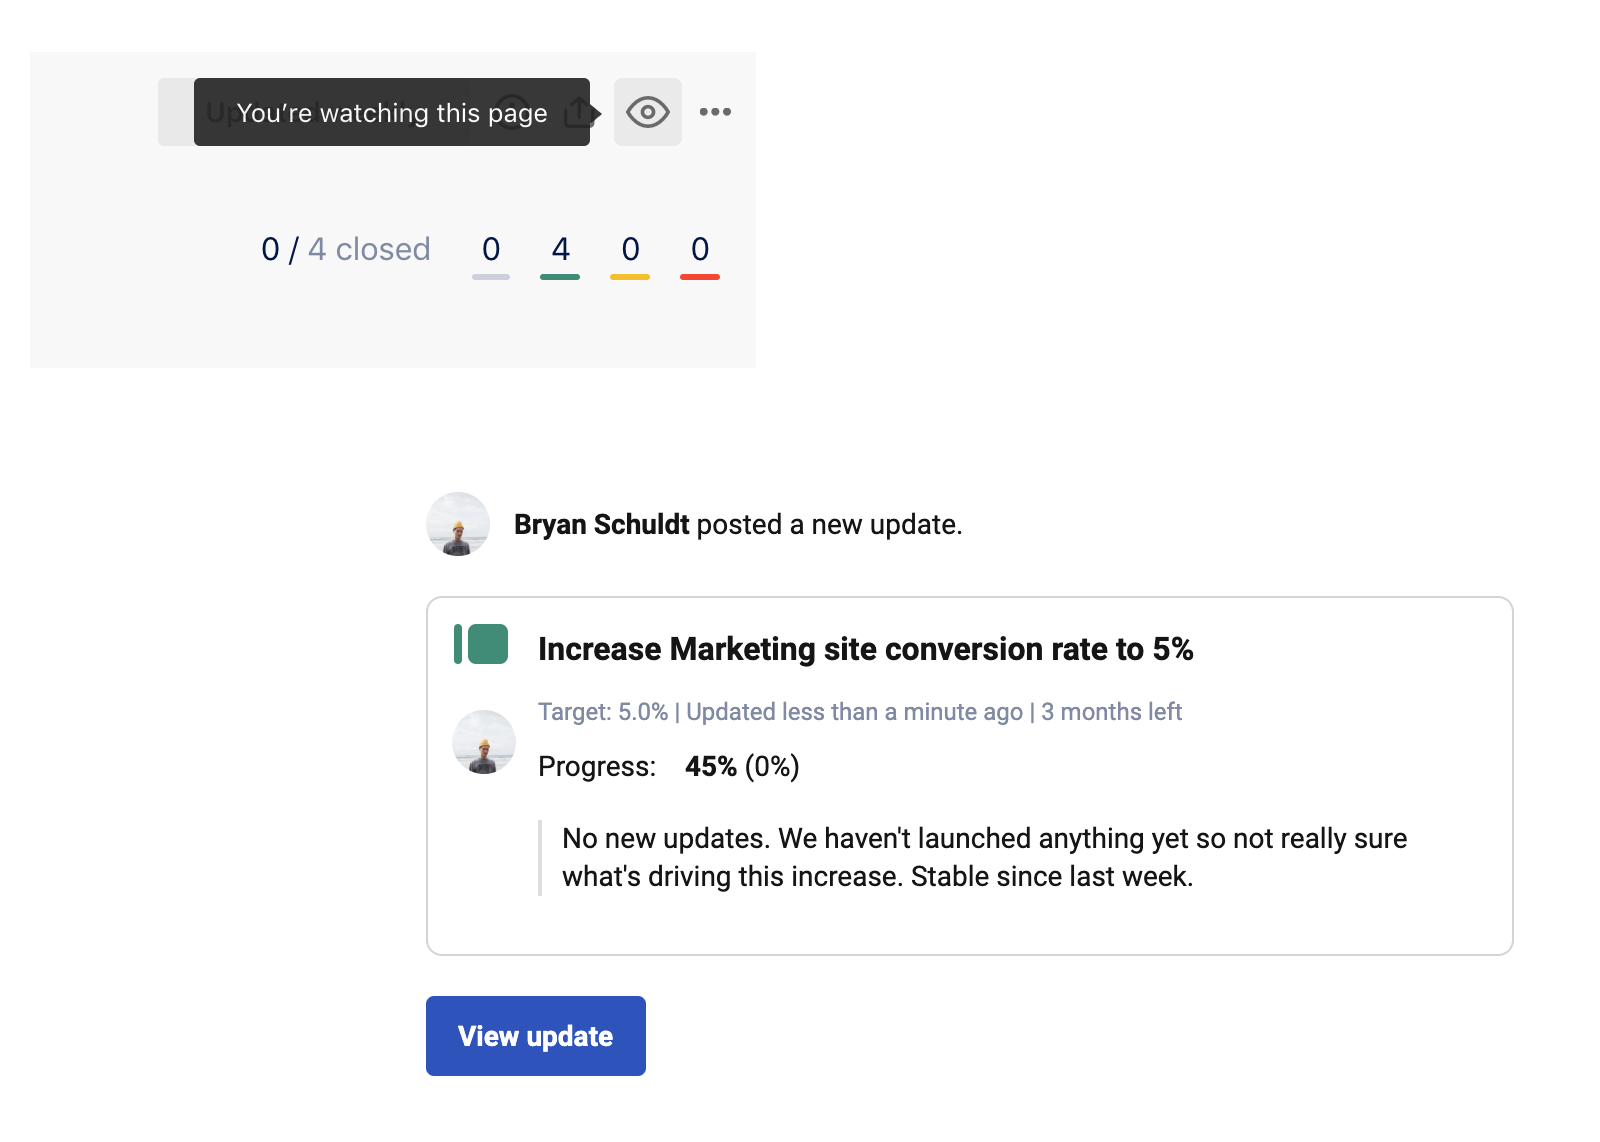
You can subscribe to a page to receive notifications whenever your team updates their goals. It's a simple way to keep track of how your peers are doing as information gets pushed to you.
You can then discuss their update and provide feedback, or you can simply show your support with likes and comments.
For team leads
As a team leads you probably want the following:
- Being able to see how your team is doing at a glance.
- Simple tools to filter the noise and focus on what requires your attention.
- An easy way to share progress with your stakeholders.
See aggregated trends at a page level

"Are we getting better or worse?"
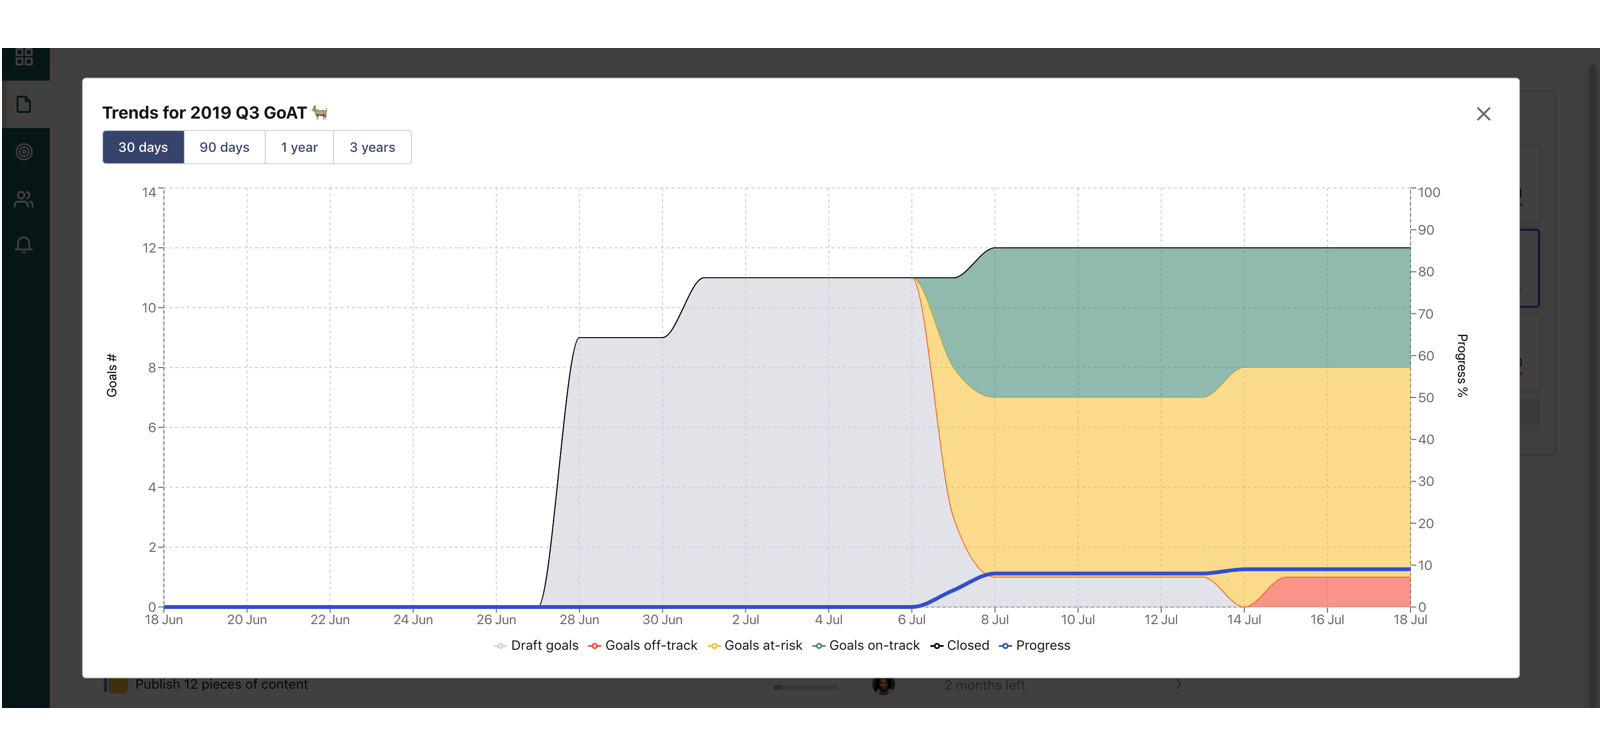
This is an essential question for team leads, and Tability makes it easy to see general trends for all the goals in a page. The platform takes a daily snapshot of the statuses to help you see if your goals are getting better (more green) or worse (more red).
Filter the noise and build custom views

You can use filters to create custom views of the goals in your workspace. For instance, you can decide to focus only on the goals that are at-risk and off-track for particular projects. Just bookmark that link and you'll be able to come back to that view in a click.
Share a summary with stakeholders

Stakeholders can have a lot on their plate, and the primary view in Tability can be a bit much for them. You can share a preview link that lets people see the latest updates for each goal, and they can always click through to see more details.
You can keep that view private, or make it available to anyone with the URL to share it with external people.
Export data to create your own reports

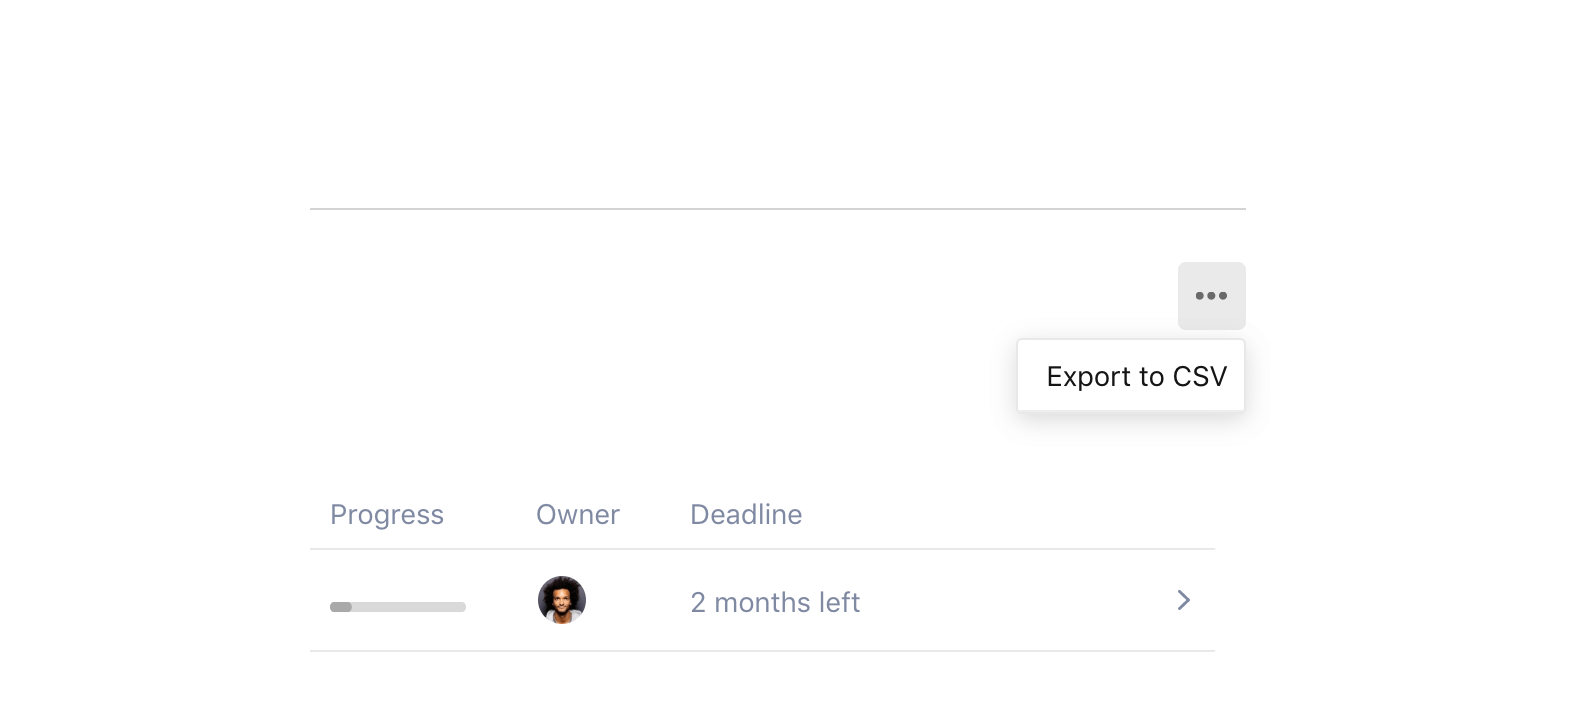
Of course, we know that we can't provide an answer to all your use cases. That's why you can always export data from the goal listing in a CSV format.
What's next?
These are just some of the ways you can use Tability with your team. We keep things simple and flexible so that you can easily use it across your organization with multiple teams.
Don't hesitate to share your feedback in the comments, and you can also follow us on Twitter @tabilityio.
You can sign up for Tability today at https://tability.io – follow me on Twitter @stenpittet.

